New to the Performance Benchmarking report: similar businesses

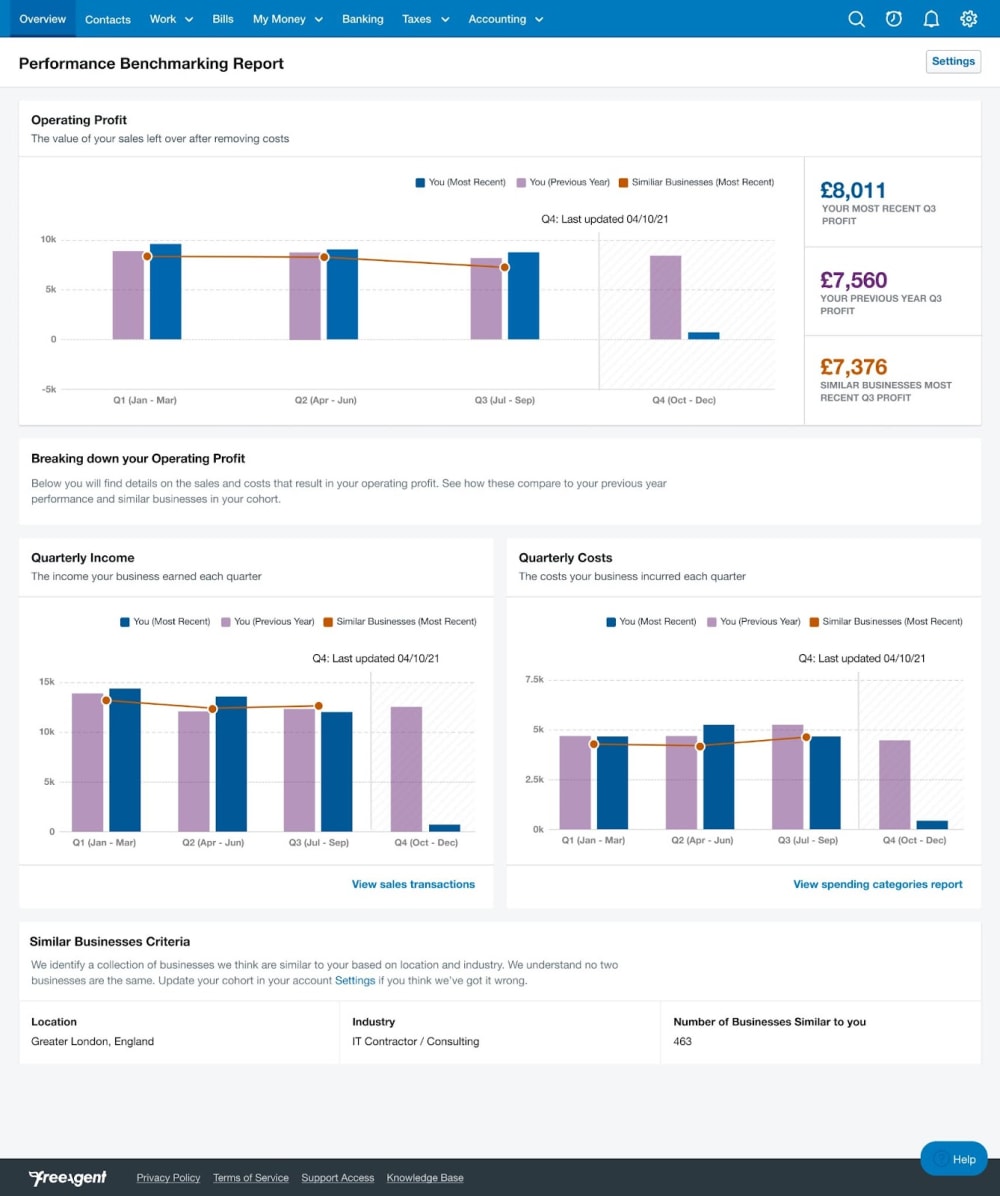
We recently launched an exciting new tool for your clients: the Performance Benchmarking report. This helps your clients get more insight into how their businesses are performing by showing their quarterly operating profit broken down into income and costs, with a year-on-year comparison if they’ve been using FreeAgent for at least a year.
We’re currently preparing to add the much-anticipated “similar business” comparison to this report, and we’ll be contacting your clients when it goes live later this month.
Your clients can soon compare their performance with similar businesses
First things first, your clients must opt in to use this feature. If they didn’t do this when we reached out to them in February, they can still do this now by following the steps in this Knowledge Base article.
If a client chooses to anonymously share their business category and region, they’ll be able to see how their business’s operating profit, income and costs compare with businesses in the same industry and region. So if they run a pet shop in Durham, for example, their similar businesses would be ‘Vet & Pet Care in North East England’, and they could compare how they were doing against this average.
Your clients’ privacy and the security of their data is of the utmost importance to us. Opting in to the similar business comparison is completely optional and any shared data will remain anonymous and unidentifiable. If they opt in, they’ll start to see similar business insights as soon as enough similar businesses have also opted in. Some clients will see their similar business data right away, but clients in more ‘niche’ careers or locations might have to wait a little longer until enough similar businesses have opted in.
We hope your clients will benefit from the insight this unique new feature brings them. We’ll email them to let them know the feature is live in the coming weeks.